Service graphs
Graph Information
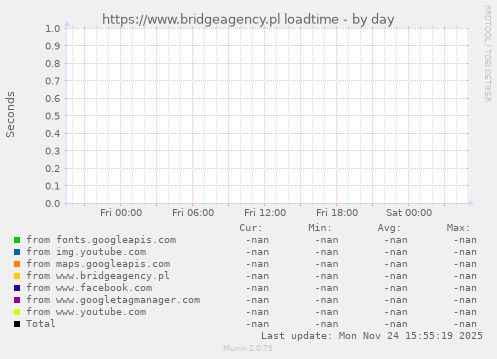
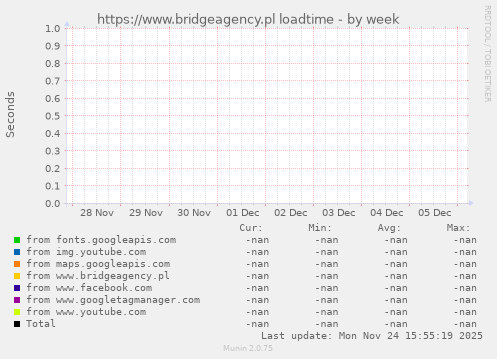
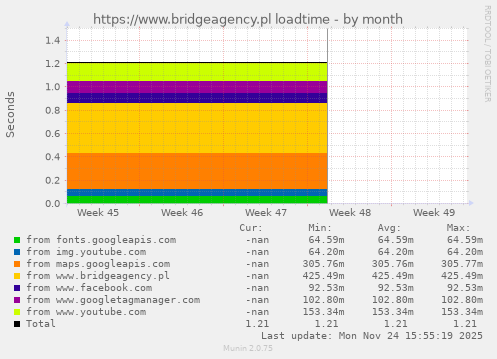
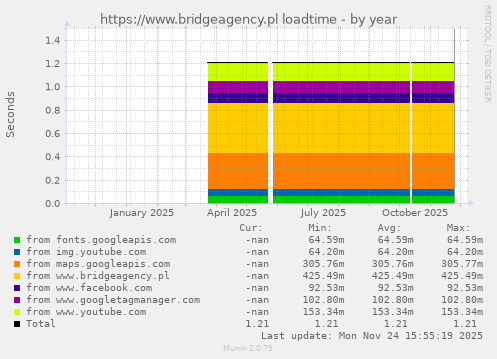
This graph is generated by a set of serial GETs to calculate the total time to load https://www.bridgeagency.pl. Note that browsers usually fork() the GET requests, resulting in a shorter total loading time.
| Field |
Internal name |
Type |
Warn |
Crit |
Info |
| from fonts.googleapis.com |
fontsgoogleapiscom |
gauge |
|
|
|
| from img.youtube.com |
imgyoutubecom |
gauge |
|
|
|
| from maps.googleapis.com |
mapsgoogleapiscom |
gauge |
|
|
|
| from www.bridgeagency.pl |
wwwbridgeagencypl |
gauge |
|
|
|
| from www.facebook.com |
wwwfacebookcom |
gauge |
|
|
|
| from www.googletagmanager.com |
wwwgoogletagmanager |
gauge |
|
|
|
| from www.youtube.com |
wwwyoutubecom |
gauge |
|
|
|